1. Trend Tracking 📊
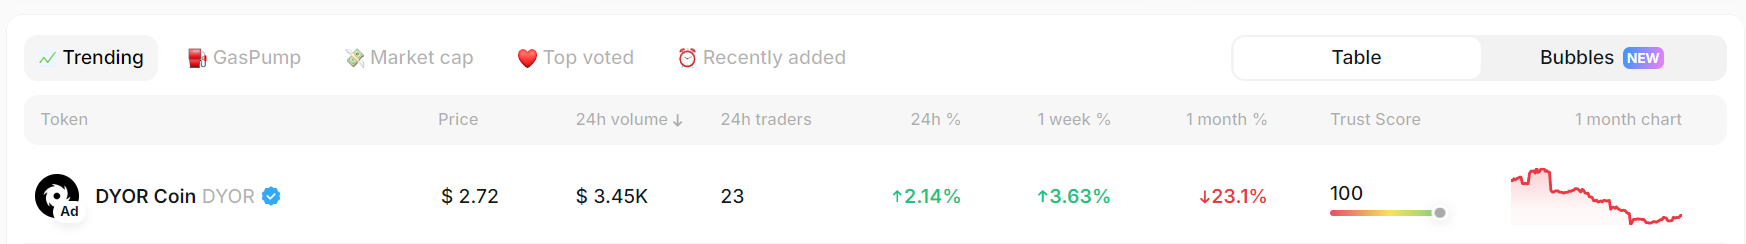
In the “Trends” section, you can:- Explore current metrics: price, trading volume, changes over 24 hours, a week, or a month.
- Evaluate tokens by Trust Level - a useful indicator to determine their popularity and reliability.
- Quickly identify market leaders and track assets gaining popularity.
2. “Capitalization” Section 💰
This section focuses on the largest market players:- Convenient sorting of tokens by market capitalization makes it easy to identify ecosystem leaders.
- Comparative analysis of the number of holders and liquidity helps understand a token’s actual demand.
3. Top Votes ❤️
Here, the key parameter is community support. What’s unique:- You can see which tokens generate the most interest through the vote rating.
- Easy access to tokens that are most discussed and liked keeps you up-to-date with hot trends.
- This section helps discover projects that receive strong user support but may still be undervalued by the market.
4. “Recently Added” Section 🌟
For those who love staying at the forefront of the market.- Displays the freshest tokens newly added to the platform.
- Creation date and time allow tracking the activity of new projects from the start.
- Analysis of initial liquidity and trading volume data provides insight into early dynamics.
5. Flexible Visualization 🔍
The platform offers two convenient formats for analysis:- Table: a classic view with all the key information for token comparison.
- Bubbles: interactive visualization where the size and color of the bubble reflect token activity. This is a quick way to spot what’s trending right now.